Data Visualization and Exploration
datawrangling, at last
Plan for final
Go find some data!
Check in with me (ideally in some form by FRIDAY) if you have not shared progress or a source of data.
Double \(y\)-axes are bad, …
… quadruple \(y\)-axes are better!
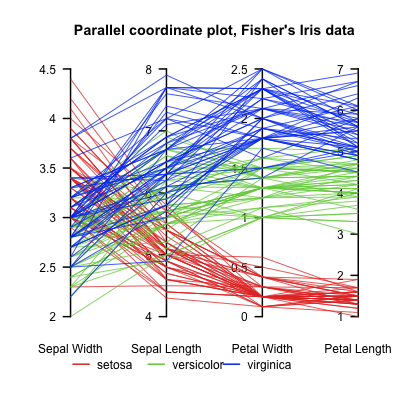
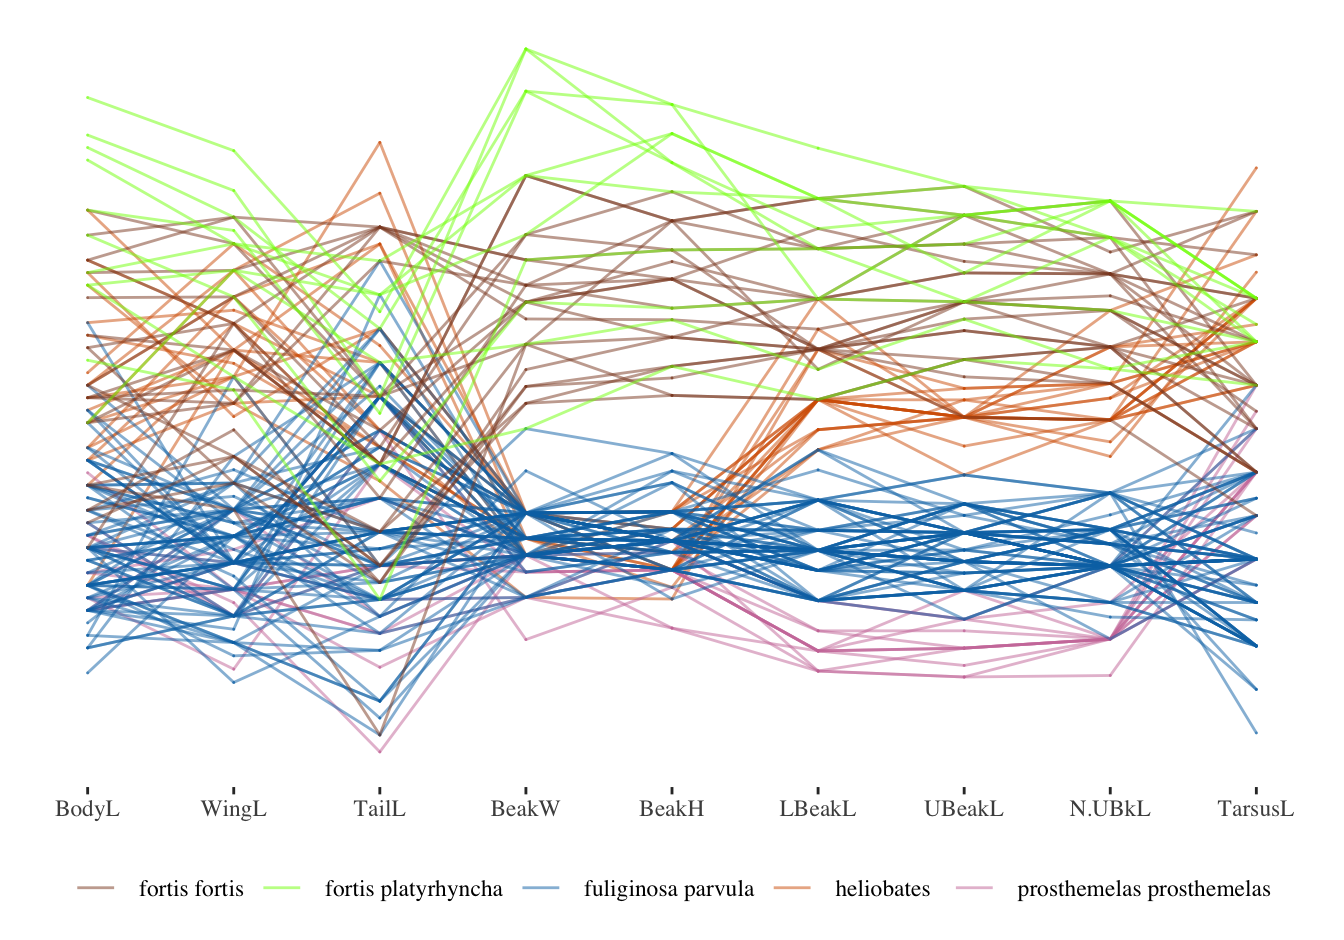
Despite the recommendation against double \(y\)-axis plots, parallel coordinate plots exist.
Conventionally unconventional
How do you feel about this graph?
Paradox
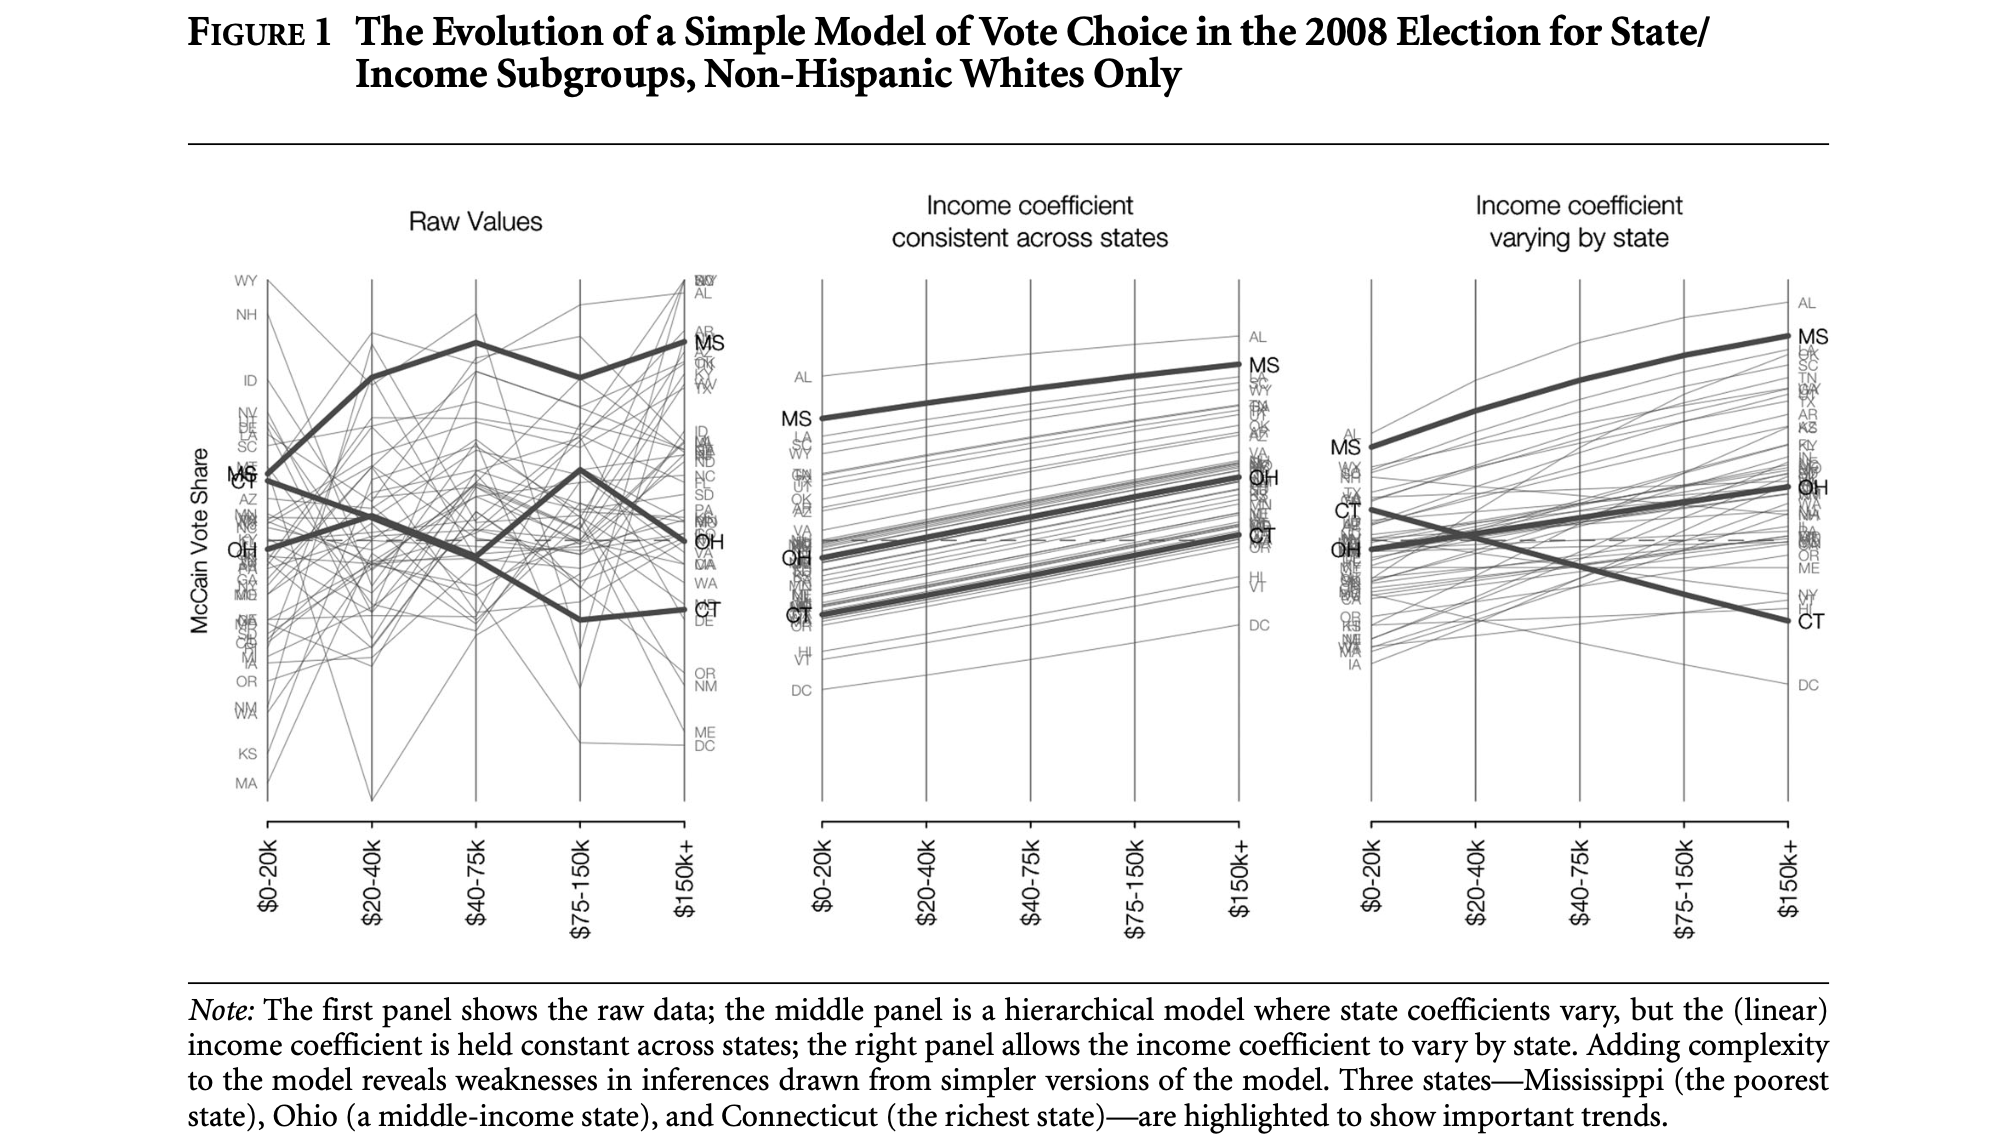
What do you notice?
Expert advice
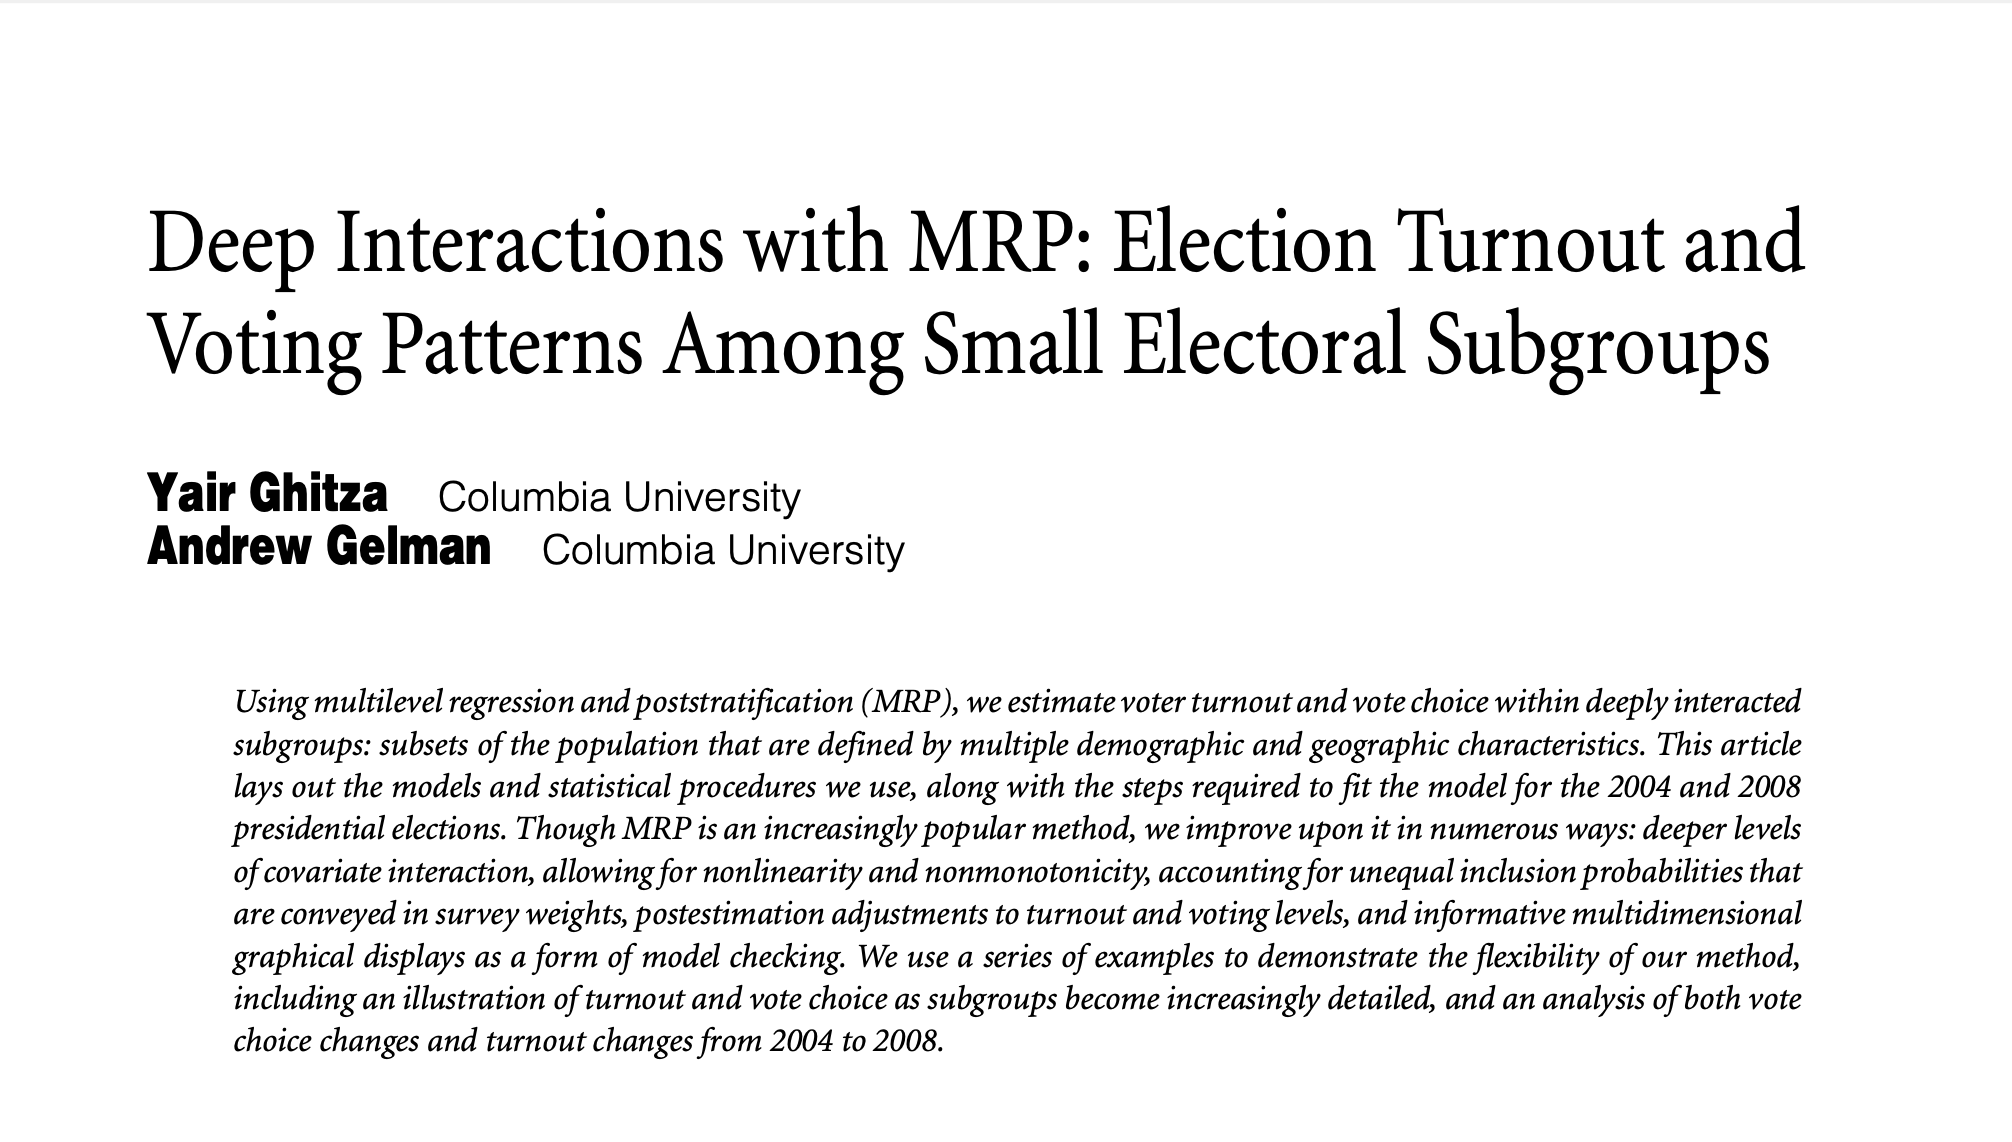
A post from Andrew Gelman which links another post, which itself links a paper.
One takeaway: “Be nice to yourself, make good graphs.”
Also: “Experts disagree, experts make mistakes. Do your best.”
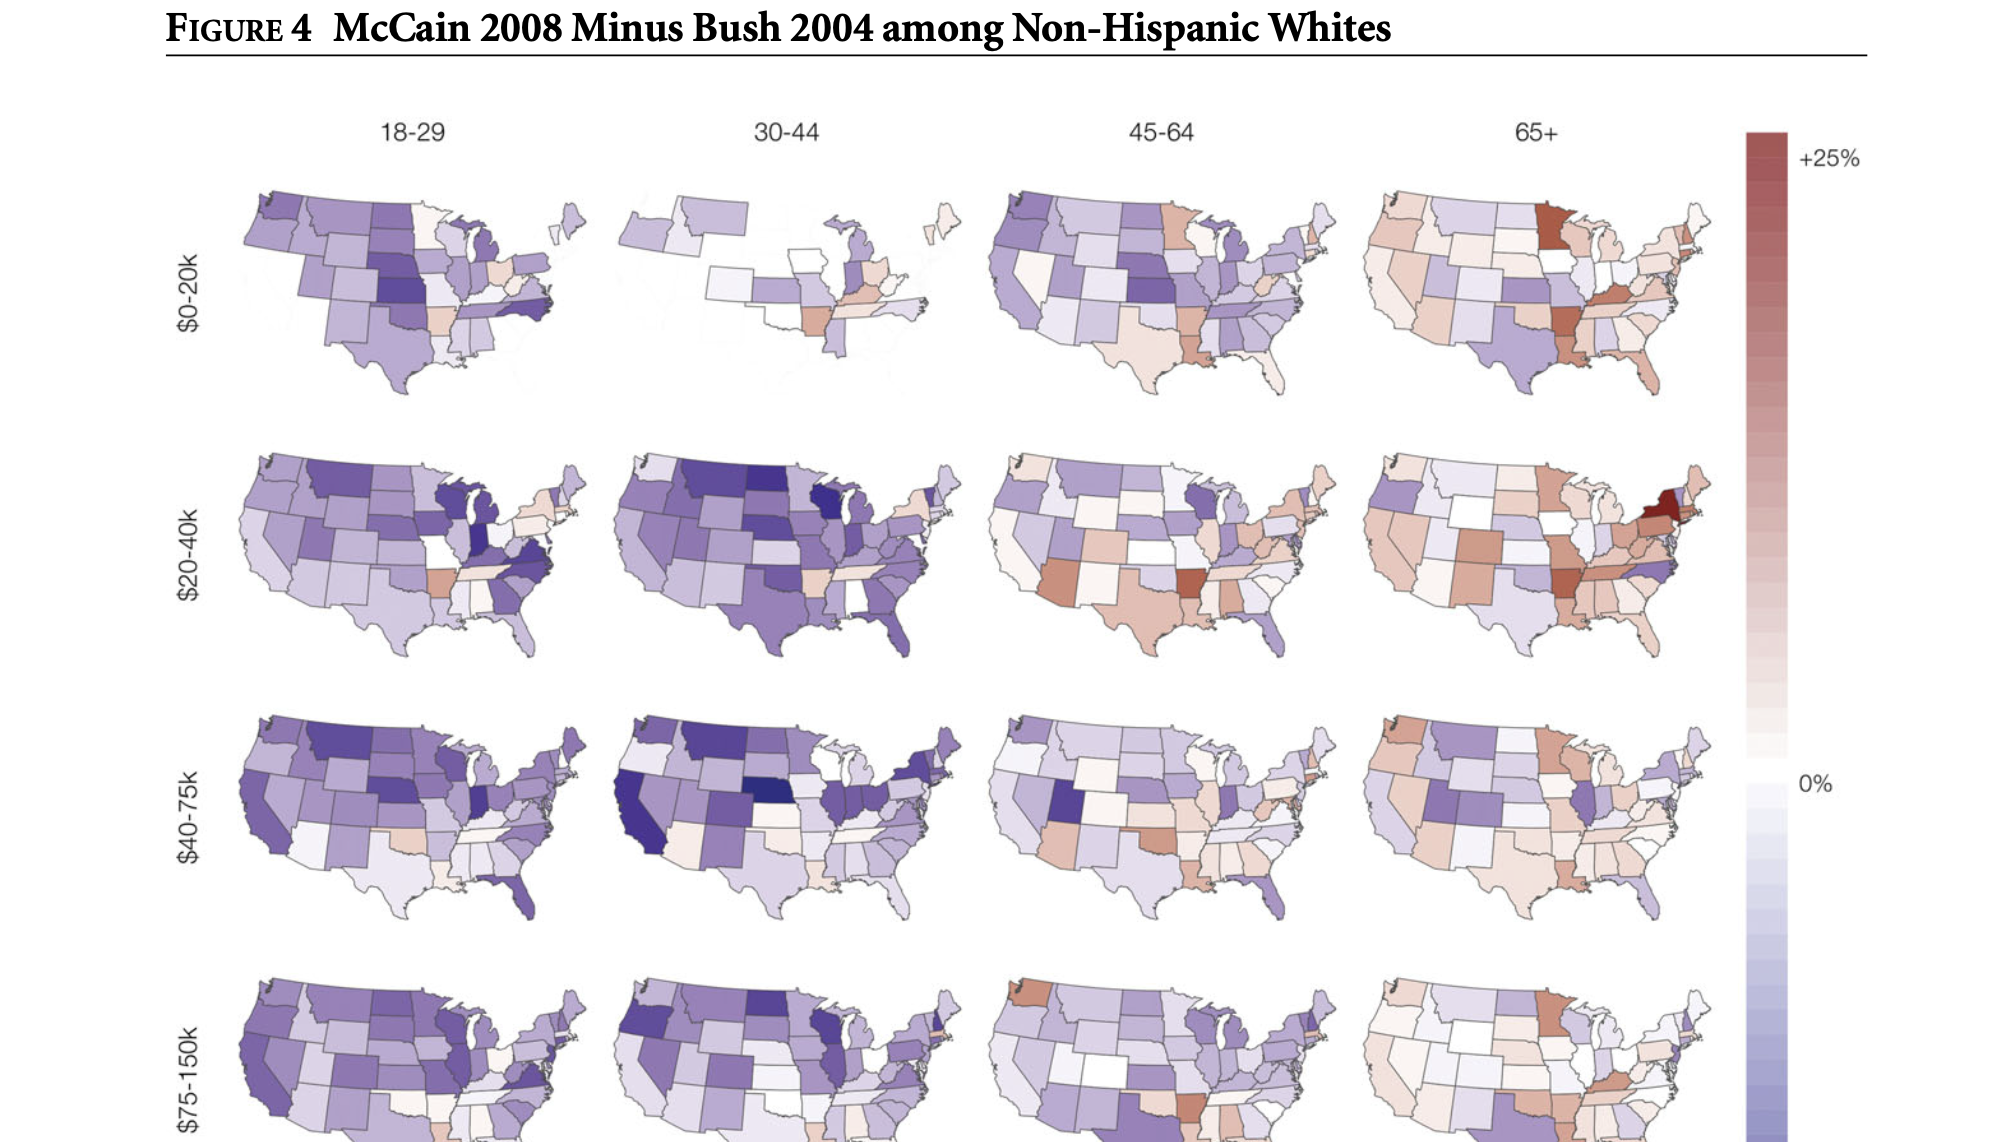
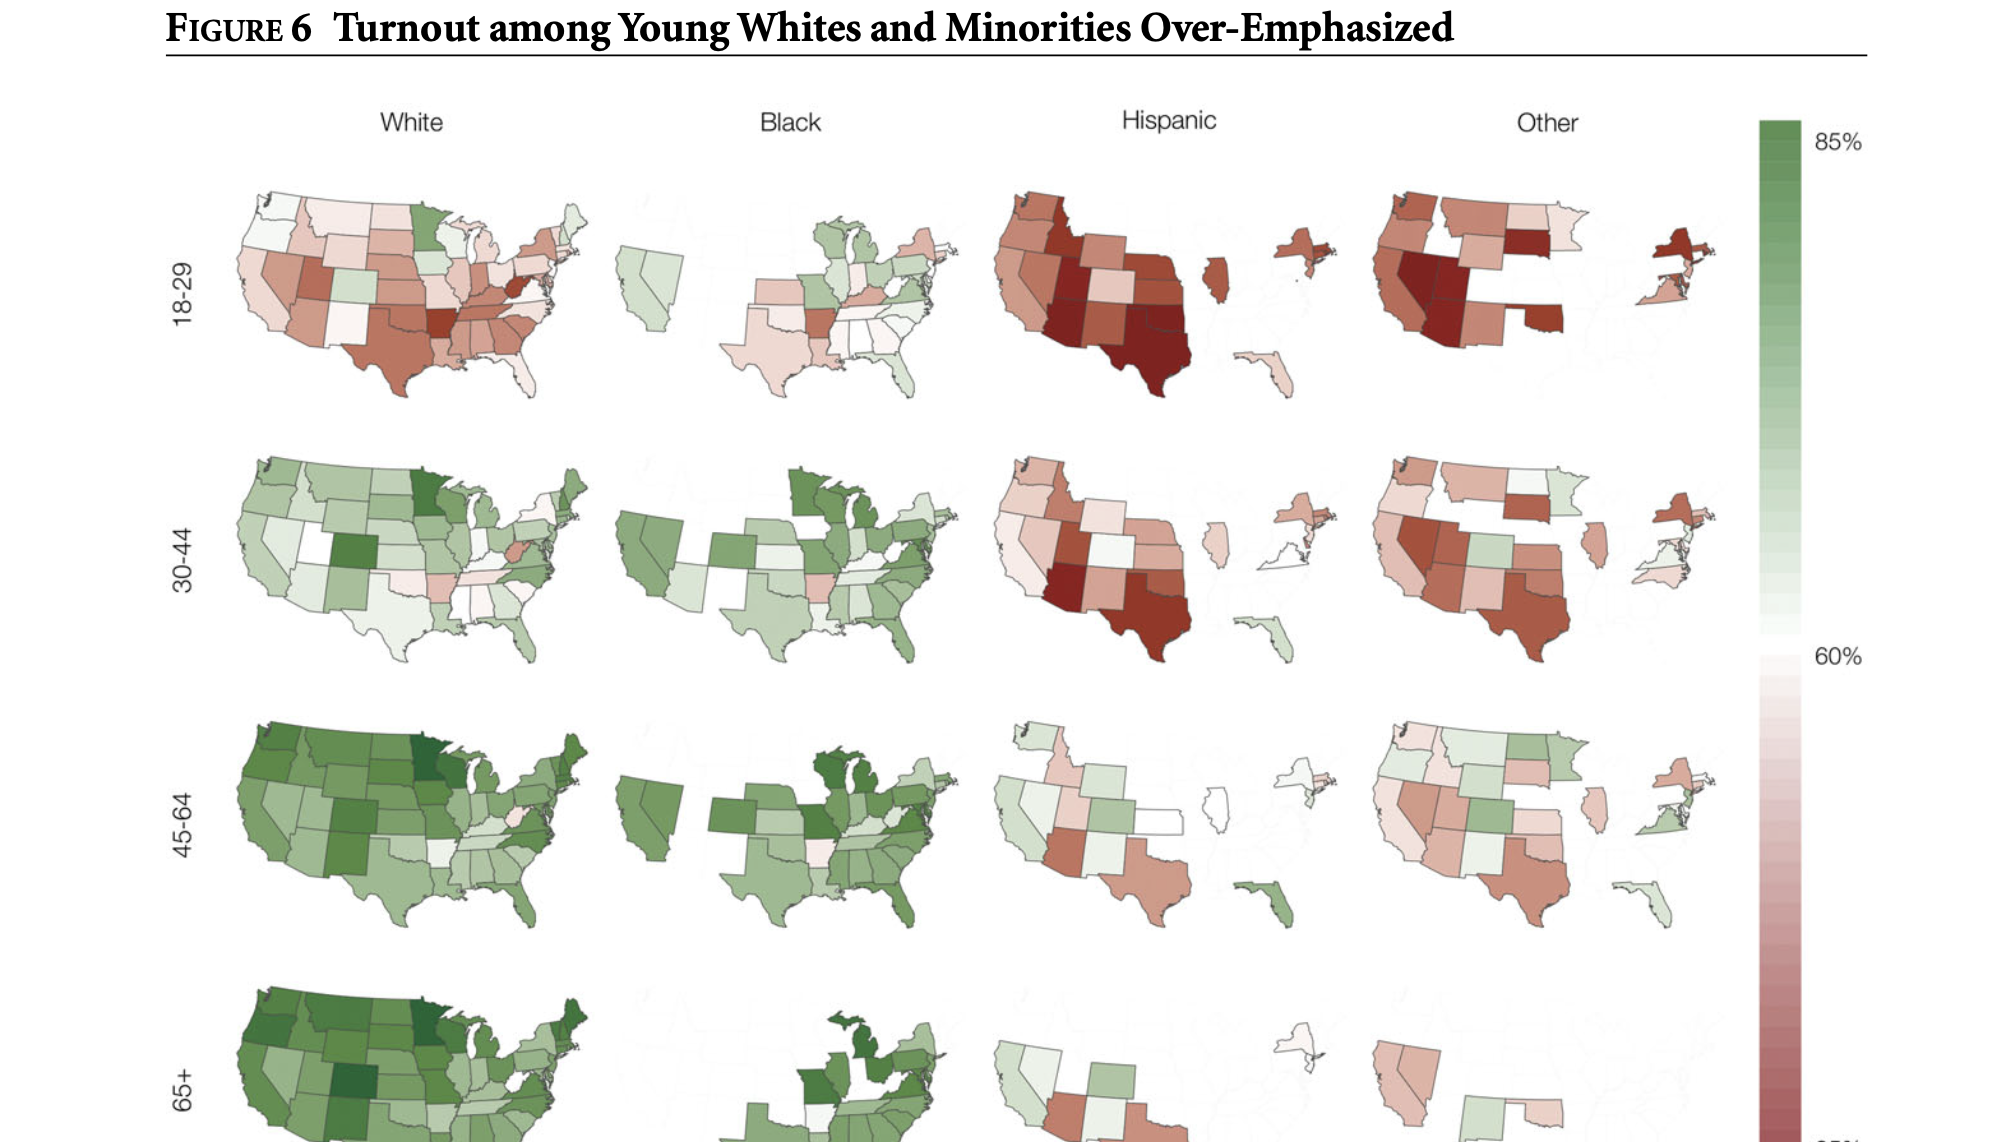
Case study in elections (Maps)
How to practice? Messy data?
Messy data could be an entire class of its own.
With luck we will explore public data sets later tonight and explore messy data next week in a small-group, hack-a-thon-style “competition”.
I made some fake data in fake_data.csv. Grab it and let’s get to work.