Data Visualization and Exploration
the end, at last
Plan for final
Go find some data!
Check in with me (especially if you have not done so yet).
Final requirements
All students are required to submit a zip file to D2L containing
- a
.Rproj launcher
- a full or representative sample of your data in
.csv form
- a
.qmd file showing your full investigation
- a
.pdf or .png file showing your infographic (to facilitate printing, you may be asked to upload this file separately)
Graduate students should submit the one page reflection described here.
Infographic
Use Google Slides/Docs, MS PowerPoint, \(\LaTeX\), Canva, or your own choice of graphic design tool tool.
The future, your future?
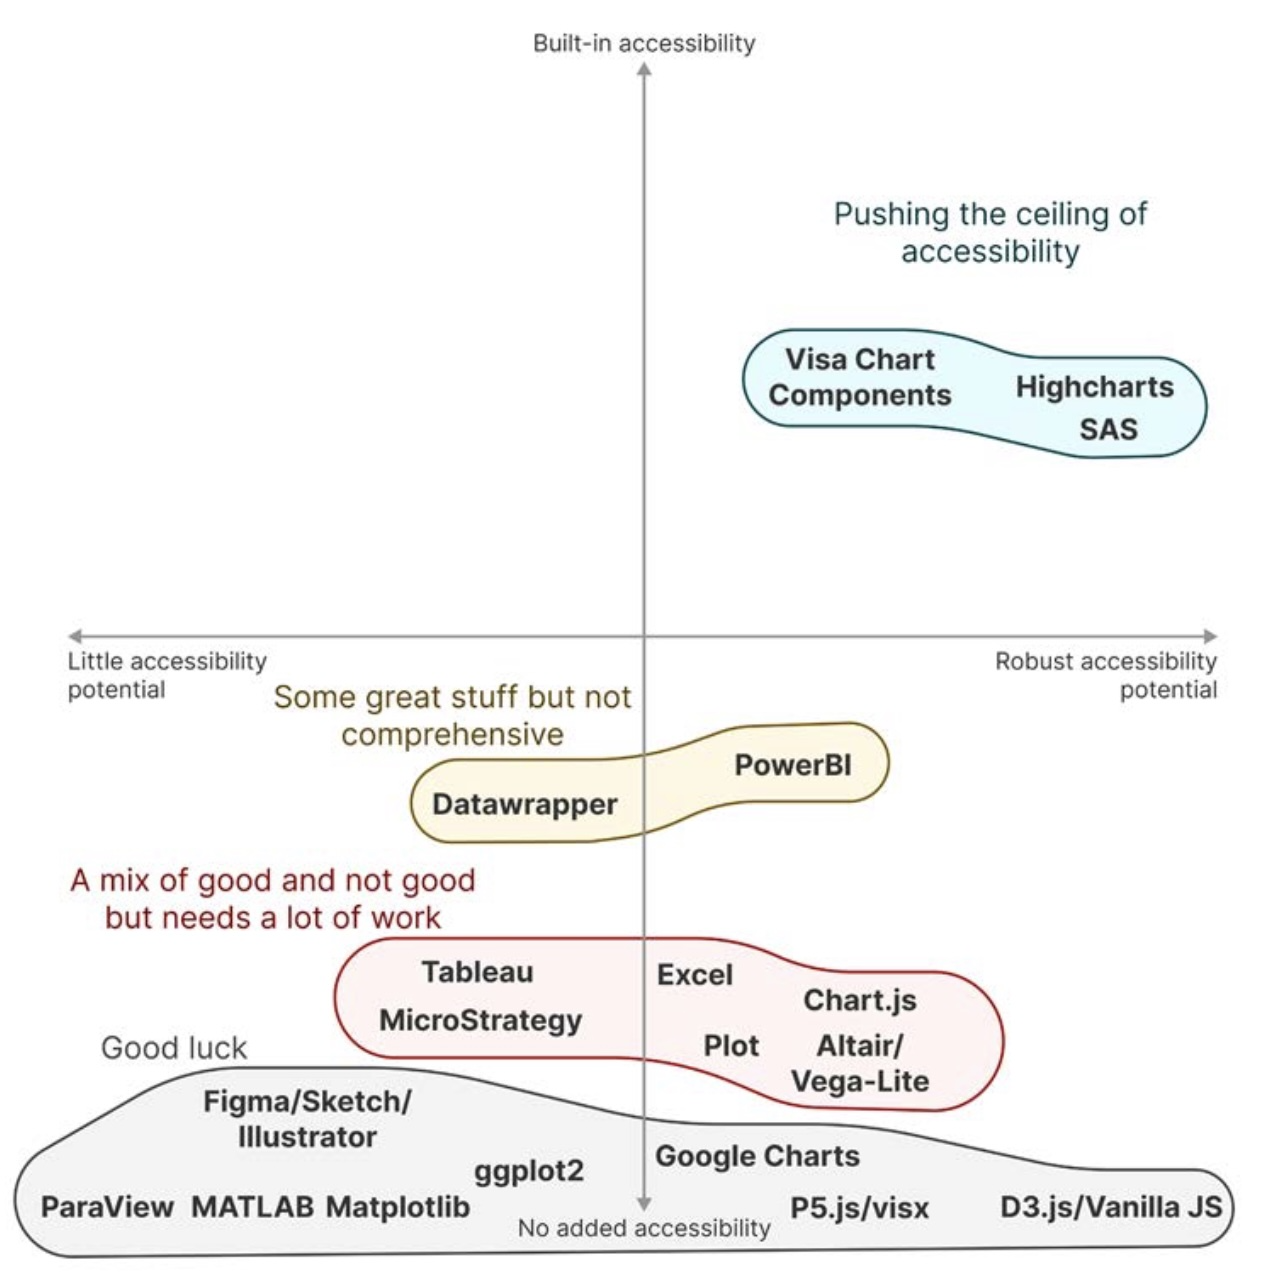
Since most tools (link) are not currently ready to produce accessible content, keep in mind the practices we have discussed,
- choice of color and contrast ratio (see http://colorsafe.co/)
- fonts and sizes
- minimalism
- alt text descriptions
- share the source and data
How to practice? Messy data?
Messy data could be an entire class of its own. We gave it one ambitious, yet still incomplete, day.
With the work completed, a few things still remain
- contemplating and addressing interactivity
- writing an alt text description
Interactivity
Creating interactive graphics requires a few considerations.
- Where will they be hosted?
- Who will use them?
Static graphics can be printed, shared, or embedded in traditional documents.
Interactive graphics are likely to be encountered in browser-based settings.
Each format comes with expectations and potential challenges.
Challenges of interactivity
Depending on the choice of tool, interactive features should be considered carefully.
- Are the colors well-selected and used strategically?
- Are mouse tooltips usable with a keyboard?
- Is data available and with clear variable names?
Plotly, plot_ly, and ggplotly
The plotly (link) library provides its own command plot_ly(), but
plot_ly() tries to create a sensible plot based on the information you give it.
Better yet, graph objects from ggplot() can quickly be made interactive with ggplotly(), a function from the plotly library.
Plotly can be used as a standalone app, cloud-based app, or with Dash (python-coded).
Saving files
If you generate an .html file, you can simply right-click on your final image and save it to a convenient directory.
If you use base R graphics, you can use the following code
pdf("filename.pdf", height = 5, width = 5)
# code for figure
dev.off()
or
png("filename.png", height = 600, width = 600)
# code for figure
png.off()
Sizes for pdf() are in inches, sizes for png() are in pixels.
Depending on how you will use the graph, you might consider bg = "white" over the default of bg = "transparent" (think about text and symbol colors).
Each contains a variety of arguments for experimentation, often legends render poorly and require a bit of size adjustment.
With ggplot() objects, you can use ggsave(name, file = "filename.pdf") which has additional arguments and accepts a variety of file extensions.
Closing examples
Picking up with our wrangled and somewhat cleaned mammal data, we can peek at interactivity.
Recalling our norovirus data, we can take one last attempt at dealing with complicated dates.