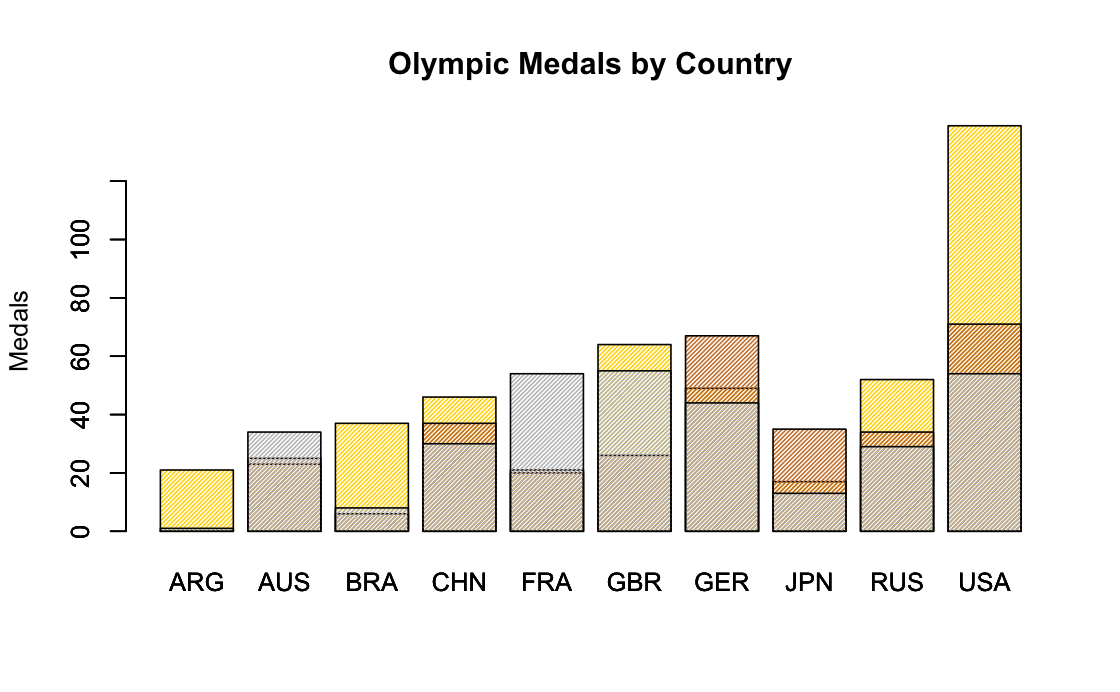
Base R vs ggplot
Both approaches rely on “layers”.
Most importantly, both should lead to reproducible graphs.
Layering graphics
- with base R, use
plot() followed by1 any of lines(), points(), legend(), axis(), text(), mtext()
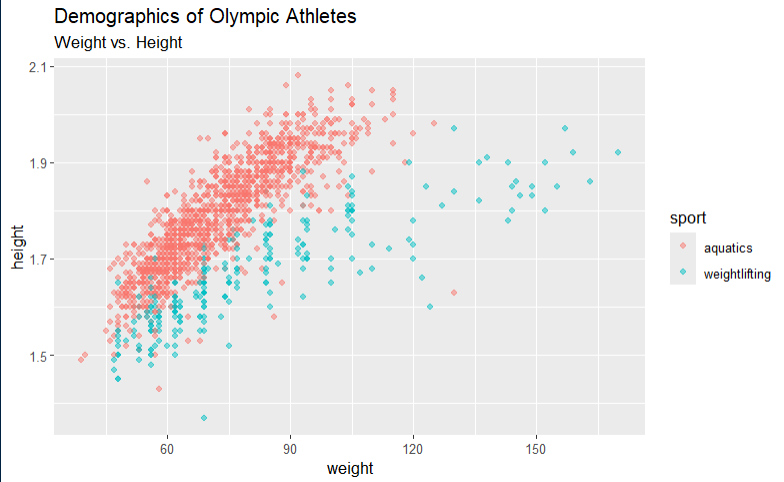
- with
ggplot2, use ggplot(data = ...) combined using + with any sensible geom_type(), legend, axis, or annotation command
ggplot and tidyverse
The + syntax in use of ggplot() can be read “followed by” or “and then”1.
tidyverse is a collection of packages (i.e., “an ecosystem”), primarily for data manipulation.
Both are good libraries to be familiar with, as is base R.
tidyverse philosophy (excerpted)
The tidyverse has four guiding principles:
- It is human centered, i.e. the tidyverse is designed specifically to support the activities of a human data analyst.
- It is consistent, so that what you learn about one function or package can be applied to another, and the number of special cases that you need to remember is as small as possible.
- It is composable, allowing you to solve complex problems by breaking them down into small pieces, supporting a rapid cycle of exploratory iteration to find the best solution.
- It is inclusive, because the tidyverse is not just the collection of packages, but it is also the community of people who use them.
What’s next
Philosophical and Practical questions?
- How to decide which tool? Do you need the new one, the fancy one, the reliable and familiar one?
- How to choose which visualization?
Technical questions?
- Can we make maps? Yes.
- Can we make dashboards1? Yes.
The pipe operator
Code written “in the tidyverse” relies heavily on the “pipe operator” or “piping”.
The good:
- The pipe,
%>%, is analogous to the + that strings together layers in ggplot().
- The pipe may make code more readable as you pass output from one step to the next, thinking “and then”.
The “bad”:
- The pipe may make it hard to ensure that the correct output moves through the pipeline.
- I, personally, find this code much less readable.
Why %>%?
The pipe is meant to be an alternative to function composition.
- Without the pipe, commands are nested inside out - the last thing to be done is first.
- With the pipe, commands accumulate top to bottom - the last thing to be doe is last.
I like to create and heavily inspect temporary objects (e.g., table(), aggregate()) as I explore.
You might like the pipe operator, but are cautioned to ensure that it actually produces what you think it produced at each step.