This was originally a plain .R script. Early in the file we were trying to read in a data set stored on a shared folder on Buddy. The shared folder was a relatively new Buddy feature (to me at least) and I couldn’t fully test it. It turned out that data from a shared folder had to be copied to an “owned” folder before use. Specifically we could not successfully set our working directory to the directory name of the shared folder.
The contents below do reflect the setup of a typical script. Below # and ## are used for comments (with no difference between one or two), but in .qmd these are interpreted as section headings (with one or two referring to different heading levels).
## setwd("STAT-4413-5413-share")## dat <- read.delim("./STAT-4413-5413-share/cards.csv")dat <-read.delim("./../data/cards.csv", header =TRUE, sep =',')## check out "head"head(dat)
     X Card Time1 Time2
1 1990    A          NA
2 1990    B          NA
3 1990    C  3.26    NA
4 1990    D  3.25    NA
5 1990    E          NA
6 KL05    A  1.28  0.71
## check out variable typesstr(dat)
'data.frame':   119 obs. of  4 variables:
 $ X    : chr  "1990" "1990" "1990" "1990" ...
 $ Card : chr  "A" "B" "C" "D" ...
 $ Time1: chr  "" "" "3.26" "3.25" ...
 $ Time2: num  NA NA NA NA NA 0.71 1.03 1.34 0.83 1.38 ...
## check "tail", can specify amount of linestail(dat, n =10)
       X Card Time1 Time2
110   Ew    A  1.05  0.97
111         B  1.19  1.27
112         C  2.O8  1.32
113         D  2.99  7.65
114         E  6.11    NA
115 WG28    A  0.86    NA
116 WG29    B  0.79    NA
117 WG30    C  0.86    NA
118 WG31    D  3.88    NA
119 WG32    E 11.42    NA
## summariessummary(dat)
      X                 Card              Time1               Time2
 Length:119         Length:119         Length:119         Min.   :0.440
 Class :character   Class :character   Class :character   1st Qu.:0.980
 Mode  :character   Mode  :character   Mode  :character   Median :1.360
                                                          Mean   :1.718
                                                          3rd Qu.:2.310
                                                          Max.   :7.650
                                                          NA's   :30
## convert Time1 to numbersdat$Time1 <-as.numeric(dat$Time1)
Warning: NAs introduced by coercion
summary(dat)
      X                 Card               Time1            Time2
 Length:119         Length:119         Min.   : 0.580   Min.   :0.440
 Class :character   Class :character   1st Qu.: 1.060   1st Qu.:0.980
 Mode  :character   Mode  :character   Median : 1.745   Median :1.360
                                       Mean   : 2.753   Mean   :1.718
                                       3rd Qu.: 3.245   3rd Qu.:2.310
                                       Max.   :22.340   Max.   :7.650
                                       NA's   :17       NA's   :30
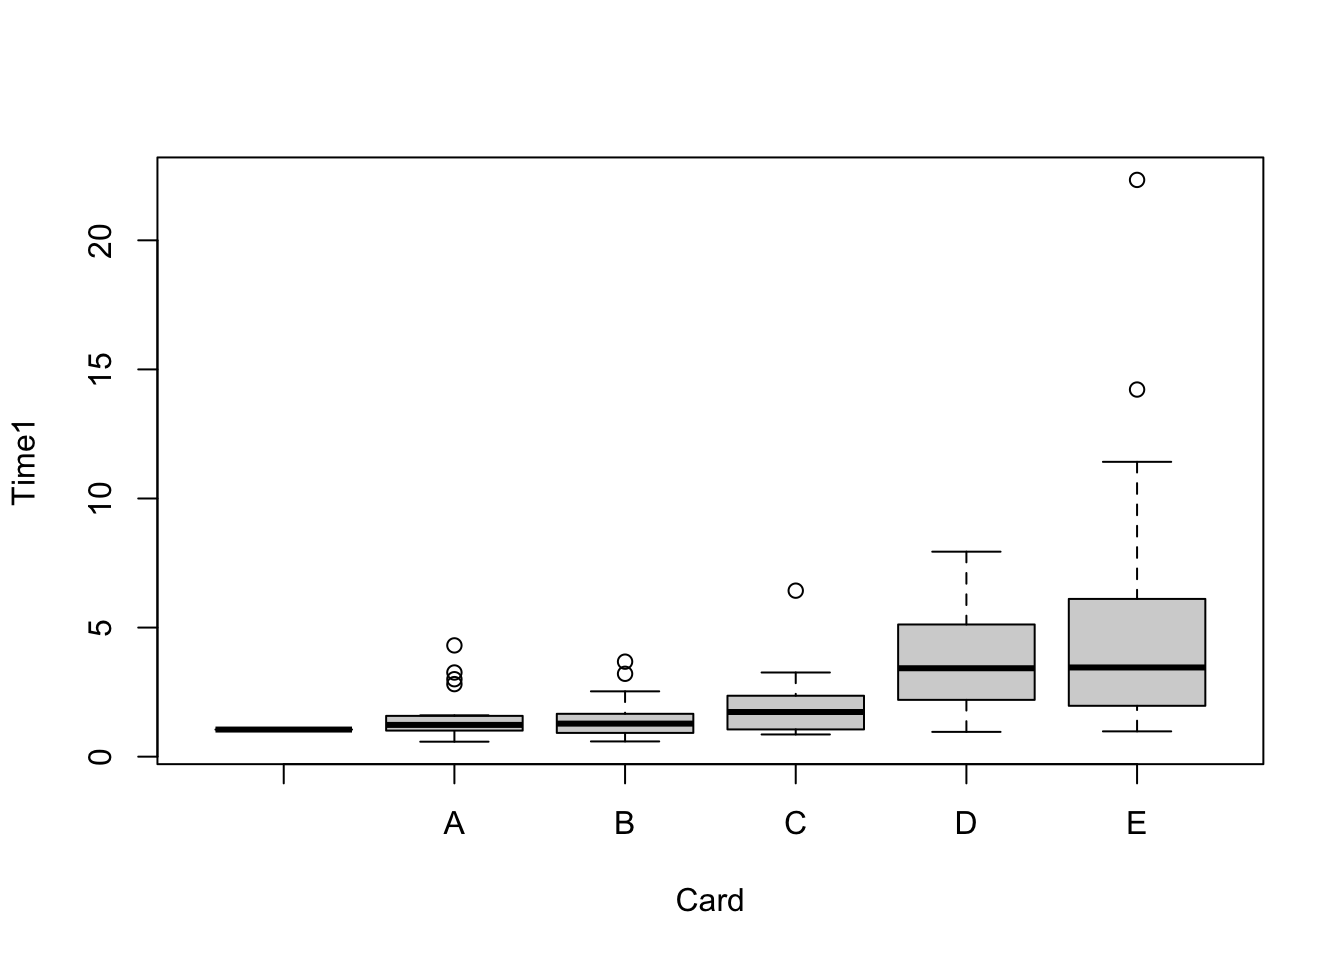
boxplot(Time1 ~ Card, data = dat)
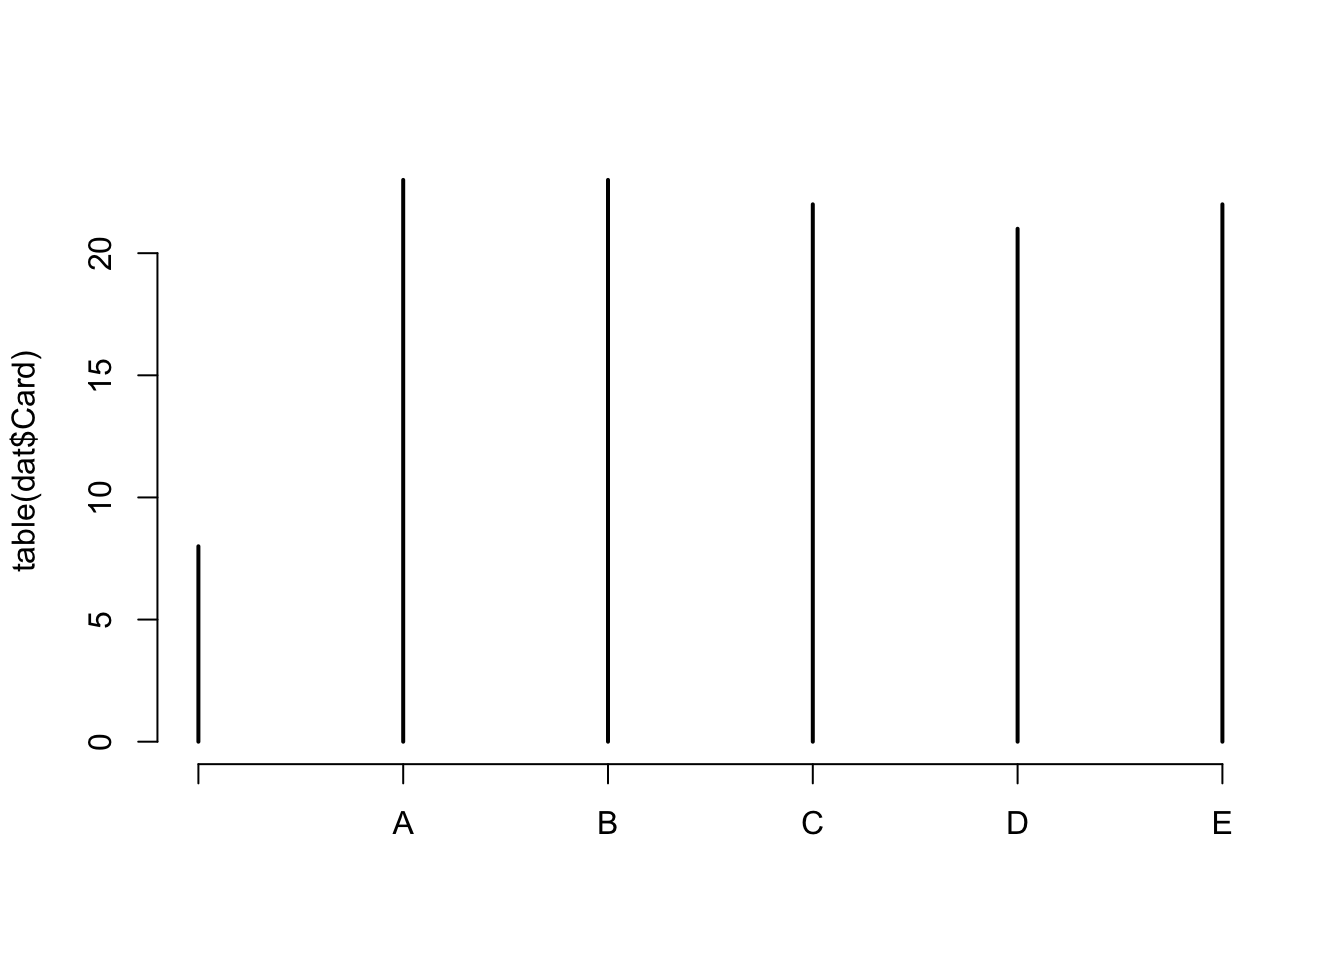
## what's that weird empty tick?table(dat$Card)
    A  B  C  D  E
 8 23 23 22 21 22
## a visual diagnosticplot(table(dat$Card))
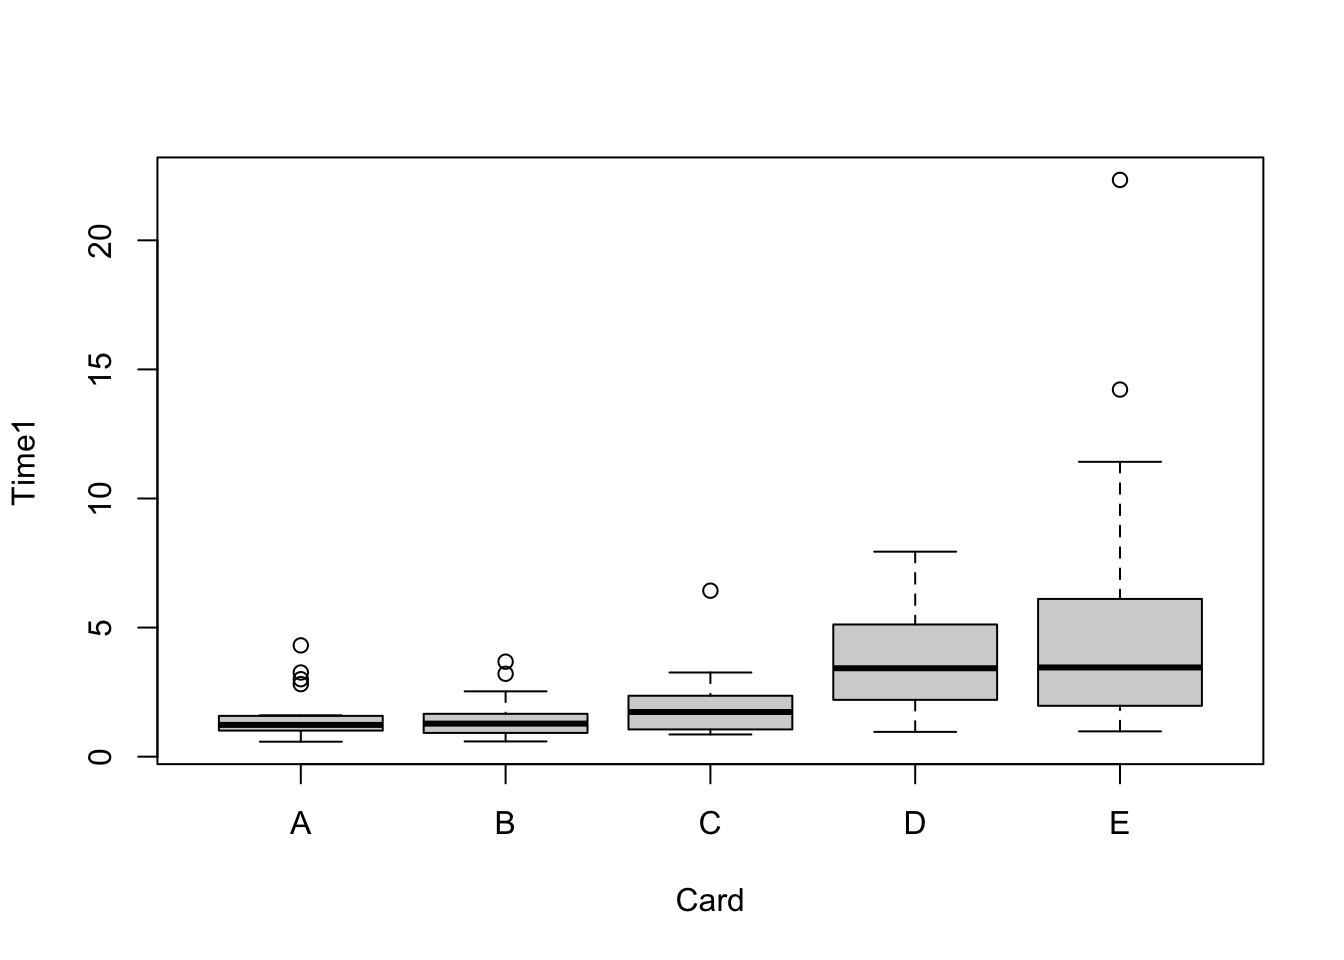
## remove empty cards(card <- dat$Card) ## ()'s around assignments prints output
  [1] "A" "B" "C" "D" "E" "A" "B" "C" "D" "E" "A" "B" "C" "D" "E" "A" "B" "C"
 [19] "D" "E" "A" "B" "C" "D" "E" "A" "B" "C" "D" "E" "A" "B" "C" "D" "E" "A"
 [37] "B" "C" "D" "E" "A" "B" "C" ""  "E" "A" "B" "A" "B" "C" "D" "E" "A" "B"
 [55] "C" "D" "E" "A" "B" "C" "D" "E" "A" "B" "C" "D" "E" "A" "B" "C" "D" "E"
 [73] ""  "A" "B" "C" "D" "E" "A" "B" "C" "D" "E" "A" "B" "C" "D" "E" "A" "B"
 [91] "C" "D" "E" ""  ""  ""  ""  ""  ""  "A" "B" "C" "D" "E" "A" "C" "D" "B"
[109] "E" "A" "B" "C" "D" "E" "A" "B" "C" "D" "E"